
Samsung Galaxy Z Fold 8 VS Honor Magic V6
We are comparing the Samsung Galaxy Z Fold 8 (Samsung) with the Honor Magic V6 (Honor). Scroll down to the pros and cons of each phone, in-depth specs, and performance highlights.
Overall Comparison
KEY DIFFERENCES OF Samsung Galaxy Z Fold 8 AND Honor Magic V6
Here’s how Samsung Galaxy Z Fold 8 and Honor Magic V6 stack up against each other in their most impactful areas.
Reasons to consider the Samsung Galaxy Z Fold 8
-
Superior display technology (Foldable Dynamic LTPO AMOLED 2X)
-
Selfie video of 4K at 30/60 fps, 1080p at 30/60 fps
-
Phone unlock via face
-
10% lighter at 201g

Reasons to consider the Honor Magic V6
-
39% larger battery (6660 mAh vs 4800 mAh)
-
23% higher AnTuTu v11 score (4144922 vs 3382020)
-
5% higher single-core Geekbench score (3834 vs 3645)
-
Higher resolution (2172 x 2352)
-
Higher Selfie Camera Resolution of 20 MP
-
12% higher multi-core Geekbench score (12396 vs 11102)
-
78% faster charging (80 W vs 45 W)
SPECIFICATION TABLE COMPARISON OF Samsung Galaxy Z Fold 8 AND Honor Magic V6
Below is the detailed specification table comparing Samsung Galaxy Z Fold 8 and Honor Magic V6.
Note: Highlighted specs mean that Phone wins that spec row.
If neither side is highlighted, it is a tie or there is not enough data for both specs.
| Specification | Samsung Galaxy Z Fold 8 | Honor Magic V6 |
|---|---|---|
|
General Information
|
||
| Brand: | Samsung | Honor |
| Release Date: | August 7, 2026 | March 13, 2026 |
| Mobile SoC: | Snapdragon 8 Elite Gen 5 | Snapdragon 8 Elite Gen 5 |
| GPU: | Adreno 840 | Adreno 840 |
| Operating System: | Android 17 | Android 16 |
| Weight: | 201 g | 224 g, 219 g |
|
Display
|
||
| Display Size: | 7.6 inches | 7.95 inches |
| Display Resolution: | 1848 x 2448 pixels | 2172 x 2352 |
| Display Pixels Per Inch: | 403 | 403 |
| Display Technology: | Foldable Dynamic LTPO AMOLED 2X | Foldable LTPO2 AMOLED |
| Display Refresh Rate: | 120 | 120 |
|
Camera
|
||
| Main Camera Setup: | Dual Camera | Triple Camera |
| Main Camera: | 50 MP + 50 MP | 50 MP |
| Main Camera Features: | LED flash, HDR, panorama | Laser AF, LED flash, HDR, panorama |
| Main Camera Video: | 8K at 30 fps, 4K at 30/60/120 fps, 1080p at 30/60/120/240 fps | 4K at 30/60 fps, 1080p at 30/60 fps, gyro-EIS, OIS |
| Selfie Camera: | 10 MP + 10 MP | 20 MP |
| Selfie Camera Video: | 4K at 30/60 fps, 1080p at 30/60 fps | 4K at 30 fps, 1080p at 30 fps, gyro-EIS |
|
Standard Lens
|
||
| Megapixels | 50 MP | 50 MP |
| Image Resolution | 8192 x 6144 | — |
| Aperture | f/1.8 | f/1.6 |
| Focal Length | 23 mm | 23 mm |
| Sensor Size | 1/1.56" | 1/1.56" |
| Pixel Size | 1 micron | 1 micron |
| Autofocus | Dual Pixel Phase Autofocus | PDAF |
| Stabilization | Optical | Optical |
|
Telephoto Lens
|
||
| Megapixels | — | 64 MP |
| Aperture | — | f/2.5 |
| Focal Length | — | 70 mm |
| Sensor Size | — | 1/2.0" |
| Pixel Size | — | 0.7 micron |
| Autofocus | — | PDAF |
| Stabilization | — | Optical |
|
Ultra-wide Lens
|
||
| Megapixels | 50 MP | 50 MP |
| Aperture | f/1.9 | f/2.2 |
| Focal Length | — | 13 mm |
| Sensor Size | 1/2.51" | — |
| Pixel Size | 0.7 micron | — |
| Autofocus | Phase Autofocus | AF |
| Stabilization | Digital | — |
|
Selfie Lens
|
||
| Megapixels | 10 MP | 20 MP |
| Image Resolution | 3648 x 2736 | — |
| Aperture | f/2.2 | f/2.2 |
| Focal Length | 24 mm | — |
| Sensor | Sony IMX374 | — |
| Sensor Size | 1/3.52" | — |
| Pixel Size | 1.12 micron | — |
| Autofocus | No | — |
| Stabilization | Digital | — |
|
Battery & Charging
|
||
| Battery Capacity: | 4800 mAh | 6660 mAh |
| Battery Life (in hours tested): | 26 | — |
| Battery Type: | Silicon-Carbon (Si/C) | Si/C Li-Ion |
| Charging Speed: | 45W | 80W |
| Wireless Charging: |
|
|
|
Performance
|
||
| RAM: | 16 GB, 12 GB | 16 GB, 12 GB |
| Storage: | 1 TB, 512 GB, 256 GB | 1 TB, 512 GB, 256 GB |
|
GEEKBENCH V6
|
||
| Single-Core (V6) | 3645 | 3834 |
| Multi-Core (V6) | 11102 | 12396 |
|
ANTUTU SCORE
|
||
| Overall (AnTuTu V11) | 3382020 | 4144922 |
| CPU | 992447 | 1252566 |
| GPU | 1292614 | 1615564 |
| MEM | 372424 | 474204 |
| UX | 724535 | 802588 |
| Overall (AnTuTu V10) | 2197874 | 4004107 |
| CPU | 1177510 | 1177510 |
| GPU | 1402206 | 1402206 |
| MEM | 501463 | 501463 |
| UX | 922928 | 922928 |
|
Connectivity
|
||
| Network Technology: | 5G | 5G |
| SIM Type: | Nano-SIM + Dual eSIM | Dual Nano-SIM + eSIM |
| Wi-Fi: |
|
|
| Bluetooth: |
|
|
| GPS: |
|
|
| NFC: |
|
|
| USB: | USB Type-C 3.2 | USB Type-C 3.1 |
|
Extras & Build
|
||
| Fingerprint Sensor: |
|
|
| Fingerprint Sensor Type: | Side Mounted | Side Mounted |
| Face Recognition: |
|
|
| Water Resistance: |
|
|
| Speaker: | Stereo Speakers | Stereo Speakers |
| Audio Jack: | No | No |
Tip: ▲ indicates a higher-is-better spec advantage, while ▼ indicates a lower-is-better advantage.
PERFORMANCE CHART COMPARISON OF Samsung Galaxy Z Fold 8 AND Honor Magic V6
The charts below visualize how Samsung Galaxy Z Fold 8 and Honor Magic V6 stack up in key performance metrics.
Radar Chart Comparison
Bullet Chart Comparison
SCREEN SIZE COMPARISON OF Samsung Galaxy Z Fold 8 AND Honor Magic V6
Here’s a proportional visualization of the Samsung Galaxy Z Fold 8’s 7.6 inches screen compared to the Honor Magic V6’s 7.95 inches display.
Samsung Galaxy Z Fold 8
7.6 inches″
Honor Magic V6
7.95 inches″
Release Timeline of Samsung Galaxy Z Fold 8 and Honor Magic V6
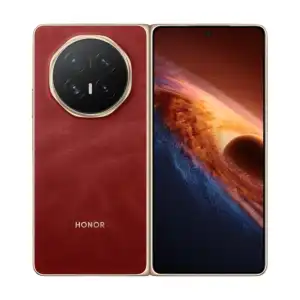
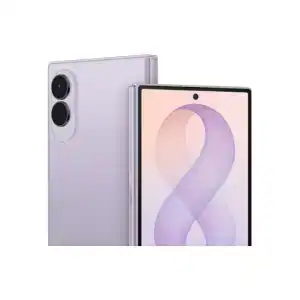
Honor Magic V6 was released 4 months, 25 days earlier than Samsung Galaxy Z Fold 8.
Value For Money Calculator
Prices use available launch or current data. Enter your own prices to see which phone gives better value.
Samsung Galaxy Z Fold 8
Honor Magic V6
Calculating...
Domain Score Summary
Scores are generated by Comparigon's scoring algorithm and are intended as a high-level guide. They may not map 1-to-1 with the individual spec-by-spec comparisons shown in the table.
Our Verdict
In conclusion, the Honor Magic V6 has a narrow overall lead compared to the Samsung Galaxy Z Fold 8. Its strongest advantages are in Performance, Camera and Battery. The Samsung Galaxy Z Fold 8 is the better fit if your top priority is Display.
Try to Compare Again One of These Phones With Another Phone
Pick which phone to keep, then search for the other phone to compare.
Disclaimer: Specs, pricing, and benchmarks are sourced from official manufacturer data and verified test results. While we strive for precision, product details and pricing may change. Comparigon may earn an affiliate commission on qualifying purchases.